What Is Graphy? The Visual Engine Behind Every Calculation
Discover how Graphy transforms calculator results into flowcharts, blocks, gauges, and charts — making math visible, verifiable, and intuitive.
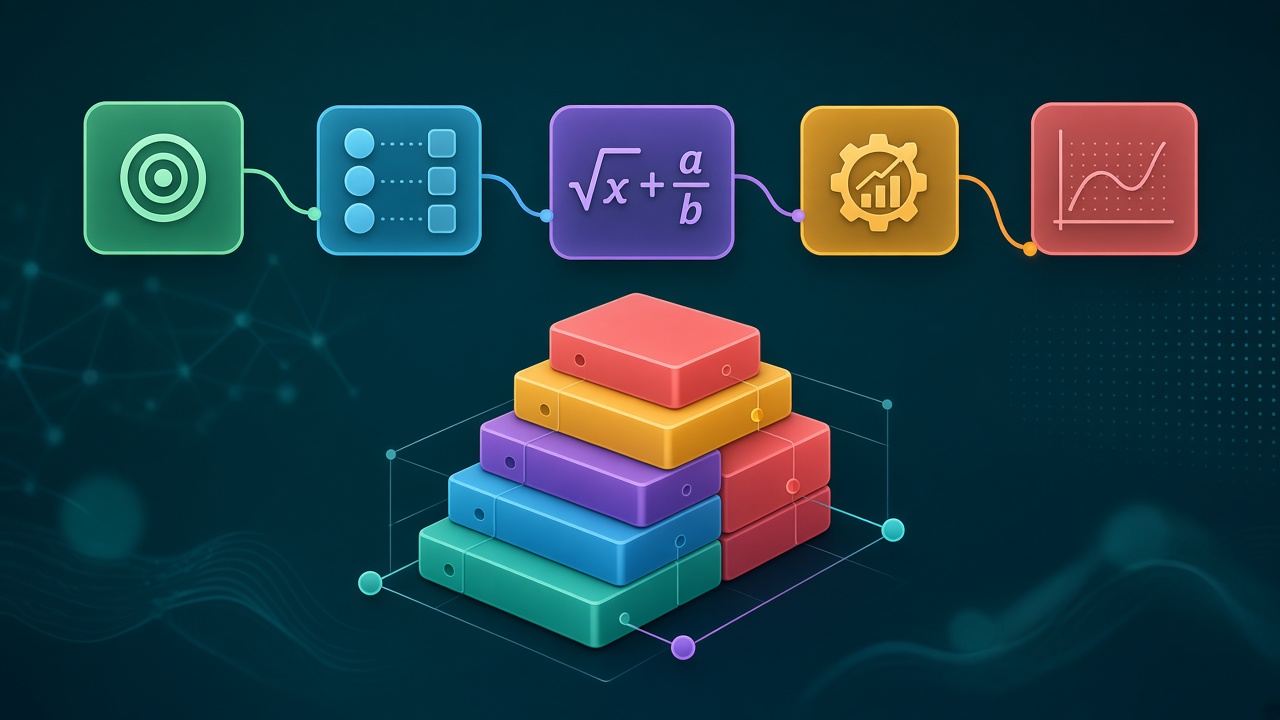
Making the Invisible Visible
Every calculator gives you an answer. Graphy shows you the journey. It is the visual explanation layer inside Graphy Calculator that transforms a finished calculation into a structured, semantic diagram — so you can see, verify, and truly understand how a result was produced.
Graphy is not a separate calculator. It is a renderer — a visual interpreter that takes the same evaluated calculation model the app already computed and presents it through your choice of visual format.
How Graphy Works
- You enter values and tap calculate (or convert units as you type)
- The Calculator Engine evaluates the formula with arbitrary-precision math
- The result appears instantly — exactly as before
- Optionally, you open the Graphy panel
- Graphy Builder transforms the evaluation into semantic nodes and connections
- Your chosen renderer (flowchart, blocks, gauge, chart) draws the visual explanation
Critical rule: Graphy never calculates independently. If the calculator says 25%, Graphy explains 25% — not 24.9% or 25.1%.
Renderer 1: Flowchart — The Universal Fallback
Every calculator in Graphy Calculator has a meaningful flowchart representation. Rounded node cards, circular operation markers, thin connectors, and generous whitespace make even complex formulas readable at a glance.
Here is how a 20% of 500 percentage calculation looks in Graphy flowchart form:
Renderer 2: Blocks — Structured Formula Breakdown
The Blocks renderer stacks color-coded segments — each representing an input, operation, or output. It is ideal when a formula has multiple distinct stages that benefit from vertical separation.
Example: converting 5 miles to kilometers (× 1.609344):
Renderer 3: Gauge — Decision Ranges at a Glance
For bounded results like BMI categories or percentage completion, the Gauge renderer places your value on a semantic scale — instantly showing whether you are in a healthy, warning, or critical zone.
Renderer Switching Without Recalculation
One of Graphy's most powerful features: you can switch renderers on the same calculation without triggering a new evaluation. Flowchart, blocks, gauge, or chart — they all consume the same GraphyOutput model. Change the view, not the math.
GraphyTheme: Consistent Visual Language
Every Graphy visualization follows shared design tokens — semantic colors, node shapes, typography, spacing, and animation contracts. Input nodes, formula nodes, compute steps, and results always look consistent across calculators. This consistency is the brand: you learn Graphy once, and it works everywhere.
Why Graphy Matters
- Trust: Verify that the app applied the right formula with the right inputs
- Learning: Students see the step-by-step logic, not just the final number
- Debugging: Professionals catch input errors before they propagate
- Sharing: Export visual explanations that others can understand instantly
Conclusion
Graphy is what separates Graphy Calculator from every other calculator on the Play Store. It does not replace fast calculation — it elevates it. Download Graphy Calculator on Google Play and experience math you can actually see.
Master Graphy Calculator
Experience the best of productivity with our premium Android application.