How to Use Graphy Calculator: A Complete Usage Guide
Step-by-step guide to calculating, converting units, opening Graphy visual explanations, and using favorites and history — without slowing down your workflow.
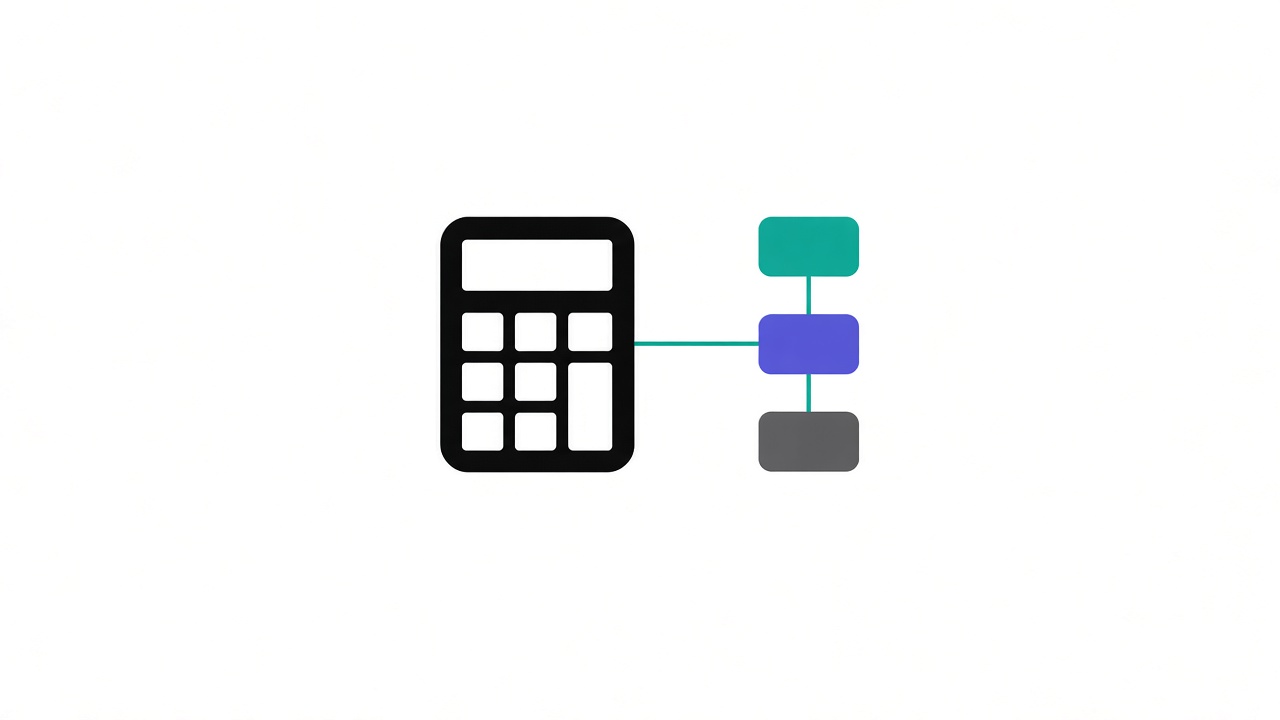
Calculate Fast — Understand When You Want To
Graphy Calculator is built around one principle: your existing calculator and unit converter workflows stay exactly as fast as before. Graphy is an optional layer you open when you want to see how an answer was produced. This guide walks you through every part of the app — from your first calculation to switching visual renderers and revisiting past results.
Getting Started
Download Graphy Calculator from Google Play and open the app. You land on the main screen with five tabs along the bottom. No account is required for core functionality — calculate, convert, and explore offline.
- Install the app from Google Play
- Open any tab — Calculate or Convert depending on your task
- Enter values and get your result instantly, just like a standard calculator
- Optionally tap the Graphy panel to see a visual explanation
The Five Tabs
Graphy Calculator organizes everything into five intuitive sections:
| Tab | What It Does | When to Use It |
|---|---|---|
| Calculate | Specialized calculators: Percentage, BMI, GST, Discount, EMI, Scientific, and more | When you need a purpose-built formula — not just basic arithmetic |
| Convert | 100+ unit categories: length, weight, temperature, area, volume, currency, and more | When you need instant conversions as you type |
| Explore | Browse calculators by category and discover new tools | When you are not sure which calculator fits your task |
| Favourites | Quick access to calculators you pin | When you use the same tools daily — BMI, GST, currency, etc. |
| History | Past calculations with full context; re-open Graphy views | When you need to verify or repeat a previous result |
Using the Calculator
The basic calculator and scientific keypad work exactly as you expect. Expression display, memory controls, and keypad behavior are unchanged from the established app — Graphy Calculator does not rebuild or replace this foundation.
Quick Calculation Workflow
- Open Calculate and select a calculator (e.g., Percentage) or use the scientific keypad
- Enter your values using the on-screen keypad
- Tap calculate — the result appears immediately
- Done. No Graphy step is required unless you want visual confirmation
Remember: Existing calculation → same result → optional Graphy explanation. Speed first, depth when you choose it.
Using Unit Conversion
The Convert tab preserves the full unit converter experience. Select a category (length, temperature, weight, etc.), pick source and target units, and type a value. Results update instantly as you type — no extra tap needed.
Opening Graphy Visual Explanations
Graphy is the visual explanation engine inside Graphy Calculator. After any calculation or conversion, you can open the collapsible Graphy panel to see how the answer was built — without triggering a new calculation.
How to Open Graphy
- Complete a calculation or conversion as usual
- Look for the Graphy panel below or beside your result
- Tap to expand — a visual explanation renders instantly
- Switch renderers (flowchart, blocks, gauge, chart) without recalculating
Critical rule: Graphy never calculates independently. What you see in the result field is exactly what Graphy explains. If the calculator says 100, Graphy shows how 100 was produced — not 99.9 or 100.1.
Choosing a Renderer
Graphy supports multiple visual formats. Every calculator has at least a flowchart (the universal fallback). Specialized calculators may also offer blocks, gauges, or charts:
- Flowchart — Input → formula → compute → result. Best for sequential logic (percentage, discount, EMI)
- Blocks — Color-coded stacked segments. Best for multi-step formulas (unit conversion, BMI)
- Gauge — Arc indicator on a scale. Best for bounded ranges (BMI categories, percentage completion)
- Charts — Bar or pie breakdown. Best for comparative results (EMI principal vs interest)
Switch renderers freely on the same result. Graphy re-renders the existing GraphyOutput — it does not re-run the math.
Favourites: Pin What You Use Daily
If you reach for the same calculators repeatedly — GST for your shop, BMI for health tracking, currency for travel — pin them in Favourites:
- Open any calculator from Calculate or Explore
- Tap the favourite (heart/star) icon on the calculator screen
- Access pinned tools instantly from the Favourites tab
History: Revisit and Verify
Every calculation is saved in History with full context — inputs, result, calculator type, and timestamp. This is especially useful when you need to double-check a figure or re-open a Graphy visualization later.
- Scroll through past calculations chronologically
- Tap any entry to see inputs and the result again
- Re-open the Graphy view for that calculation without re-entering values
Specialized Calculators at a Glance
The Calculate tab includes purpose-built tools beyond basic arithmetic. Here is when to reach for each:
| Calculator | Use Case | Graphy Renderer |
|---|---|---|
| Percentage | Find X% of Y, increase/decrease by percentage | Flowchart, Blocks |
| BMI | Body Mass Index from weight and height | Gauge, Blocks, Flowchart |
| EMI | Monthly loan payment for home, car, or personal loans | Bar chart, Flowchart |
| GST | Add or remove Goods and Services Tax | Flowchart |
| Discount | Calculate sale price after a percentage off | Flowchart |
| Scientific | Trigonometry, logarithms, expressions with memory | Flowchart |
Practical Tips
- Speed first: You never need to open Graphy. Use it when understanding matters — homework, invoices, health checks, loan decisions.
- Verify before sharing: Open Graphy before sending a result to a client or classmate. The visual breakdown builds trust.
- Explore by category: Not sure which tool to use? Browse Explore by topic — finance, health, conversion, and more.
- Offline-ready: Core calculator and converter functions work without an internet connection.
- Dark mode: Graphy visualizations follow the same theme tokens in light and dark mode for consistent readability.
What Graphy Calculator Is Not (Yet)
Graphy Calculator MVP focuses on adding visual explanations to existing functionality. The following are planned for future releases but not part of the current experience:
- Coins, timeline, and XY graph renderers (coming progressively)
- AI-powered insights and what-if suggestions
- Advanced PDF export
- Full catalog of 100+ specialized calculators (expanding over time)
Ready to Try It?
Calculate as you always have. Open Graphy when you want to understand the math behind the number.
Get Graphy Calculator on Google PlayWant to go deeper? Read What Is Graphy? for the visual engine explained, or see Graphy Calculation Examples with percentage, BMI, and EMI walkthroughs.
Usage Guide FAQs
| Question | Answer |
|---|---|
| Do I have to open Graphy every time? | No. Graphy is completely optional. Your calculator works at full speed without it. |
| Will Graphy change my result? | Never. Graphy visualizes the same calculation the app already performed. |
| Can I use the app offline? | Yes. Core calculator, converter, and Graphy rendering work offline. |
| How do I find a specific calculator? | Use Explore to browse by category, or search from the Calculate tab. |
| Can I revisit a past Graphy view? | Yes. Open History, tap the entry, and re-open Graphy for that calculation. |
Graphy Calculator — Calculate fast. Understand deeply.

Master Graphy Calculator
Experience the best of productivity with our premium Android application.